Analysis
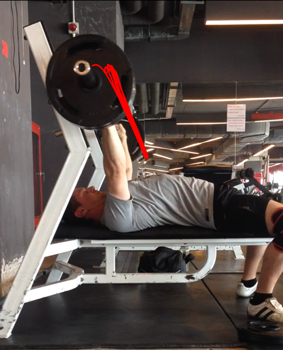
Bar Path
Touch the screen to reveal the scrubber. Drag through the video to show the path the bar follows.

Graphs in Landscape Orientation
Rotate your device to the landscape orientation to bring up the graphs.
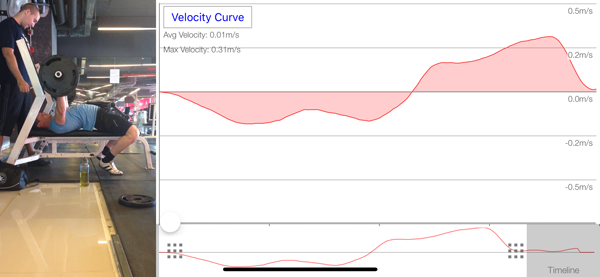
The default graph is a velocity profile of the bar movement across the entire video. In the example shown above, the selected video consists of a single repetition. The bar is first lowered to the chest and then pressed back up. This is reflected by the negative and positive velocity areas of the curve, respectively.
Advanced Analysis – Sticking Point
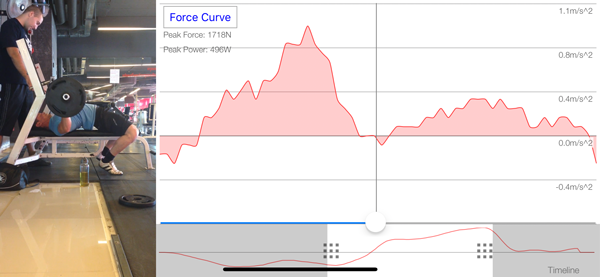
Tap on the Velocity Curve button to view force output. In the example below, the video scrubber has been positioned at the force minimum during the lift, which is the sticking point. Initial force off the chest looks quite explosive. Paused bench presses as a supplementary exercise will therefore probably not address a significant weakness. Paused board presses at the sticking point would probably be more useful. Bench presses with bands or chains might also help speed up the apparently sluggish recovery of force output after the sticking point.
Recommendation:
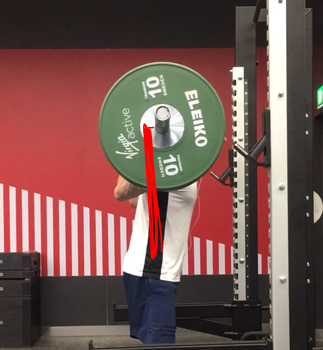
1) Paused board presses (rotate back to portrait mode to estimate ideal board height)
2) Bench with chains/bands

Advanced Analysis – Reps & Intensity
Bar Path can be used to determine ideal rep targets and intensity zones. Here I will start with 5 rep tests with various %s of 1RM.
5 Reps @ 60%
Notice there is little variation between reps in the plotted path. This indicates readiness to perform at a higher intensity.
5 Reps @ 70%

The increase in intensity has created a bit more variation between the reps. However, there is no significant variation in the shape of the path between reps. Keep going and watch for the breaking point.
5 Reps @ 80%

The breaking point appears to be the 5th rep in this set. Notice how the last rep follows a curved path while the first four reps followed the same linear path as in the 60% and 70% tests.
Recommendation:
1) Work at 80% should be limited to 4 reps, right at the breaking point threshold.
2) Repeat the test with 4 reps up to 85% to determine rep threshold at 85%.
3) Since form already started to show some instability at 70%, work at intensities greater than 80% should be limited until form stabilizes to a greater degree.
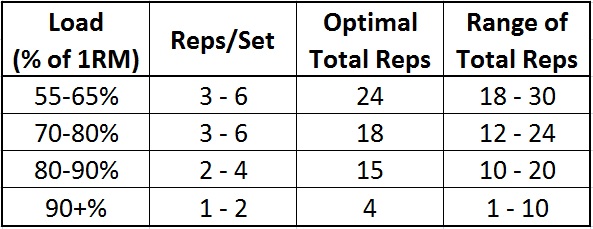
Use this process to create your own, personalized Prilepin Table.
Advanced Analysis – Reps & Intensity Part II
The same 5 rep tests were repeated for the squat. The results are as follows.
5 Reps @ 70%
Here we can see what a relatively easy set looks like. A little variation between reps is visible, but nothing major. Let’s continue.
5 Reps @ 80%
Some form breakdown was expected here. However, nothing is evident. In fact, this looks even better than the set at 70%. That’s the green light for adding some more weight.
5 Reps @ 85%
Once again, some form breakdown was expected but none was observed at 85%.
Recommendation:
1) Contrary to the bench press, place an increased emphasis on squat sets above 85% 1RM.
Hopefully, by now you’ll notice the tremendous contribution this can make in your training program.