Can we do better than Wilks? Absolutely
A coach wants to compare strength between his 185 lb cornerback and his 265 lb defensive tackle. The cornerback squats 420 lb and the defensive tackle squats 590 lb. In absolute terms, the defensive tackle is stronger. But that’s not very surprising given his larger body size. Strength is related to the cross-sectional area of the muscles and, consequently, indirectly to body mass. Therefore, a larger athlete is expected to lift a larger load. These two athletes need to be compared on the basis of relative strength, which takes into consideration the difference in body mass. But how?
A brief history
Numerous mathematical models have been developed over the years in an attempt to compare relative strength. The simplest and most straightforward is to divide the amount lifted by body mass. This creates a ratio that can be used to compare individuals. While simple, this approach poorly reflects actual results since strength and body mass have a non-linear relationship.
As far back as 1937, it was recognized that because strength is proportional to muscle cross-sectional area and body mass is proportional to volume, isometric scaling (or the square-cube law with a 2/3 exponent) offered an intellectually pleasing theoretical model for fitting body mass to strength. Lietzke (1956) demonstrated an isometric scaling relationship between then current world records in Olympic Weightlifting and body mass. Subsequent findings by several authors (1, 2) showed that this relationship does not hold when including body masses >90kg. In retrospect, this is intuitively simple to understand. An isometric scaling relationship assumes that all lifters are perfect geometric copies of each other, scaled to different sizes, which they obviously aren’t. There are numerous anatomical differences between any two people. A few years later, Austin proposed an updated allometric model with a 3/4 exponent, which does not assume perfectly scaled copies. Nevertheless, a few researchers persisted with the 2/3 exponent and once again showed it to fit 1971 records modestly well, so long as heavier weight classes were again omitted.
Fast forward a few years. In an effort to eliminate bias between the weight classes present in allometric models, researchers turned from theoretical models to statistical models and published formula tables (e.g., Malone, Schwartz, and Wilks) one can use to calculate relative strength. As of yesterday, the Wilks formula has performed the best in this regard. Unlike the previously introduced strength/mass ratio and allometric model variations, no weight class is systematically favored or disfavored in Wilks. It is currently the official formula used in powerlifting.
The Wilks formula successfully transforms strength and body mass into a single number that can be used to compare lifters of different sizes. The coach in our previous example could use Wilks to determine that the defensive tackle has a greater relative strength and the cornerback has some work to do.
So what’s the problem?
It is almost predetermined that the relative strength overall winner will come from the Men’s Open group. That means it’s actually favoring absolute strength, exactly what it was not supposed to do. For a formula based on the goal of eliminating bias in order to compare the relative strength between two different lifters, it seems Wilks was only partially successful.
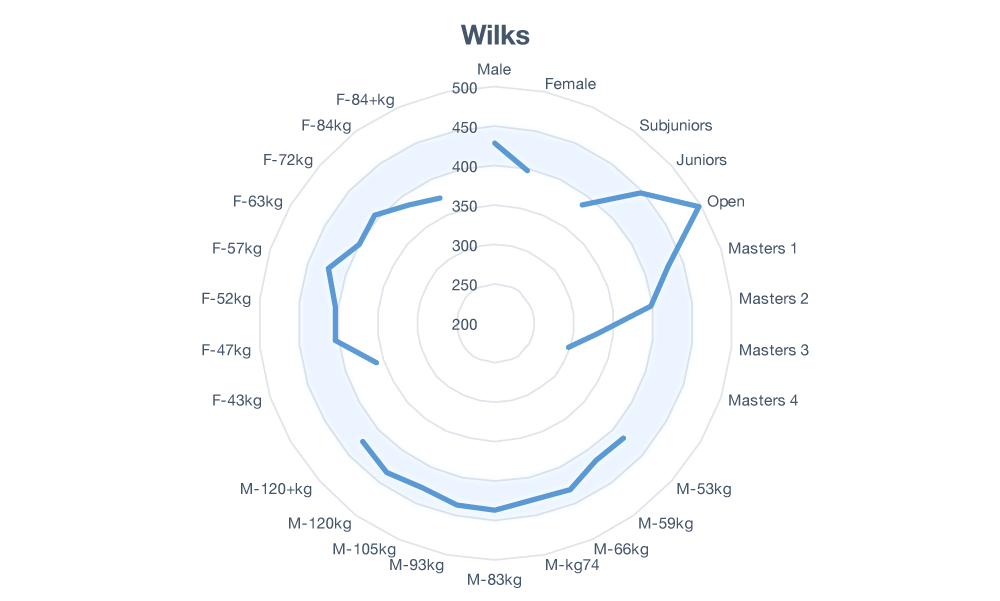
Let’s turn to some data to help visualize the issue. We’re going to look at every 1st place finish at an IPF World Championship since 2012. That should provide enough data (n=383) to ensure robust results which will not need to be updated if a new record is set somewhere. Next, we’ll average the Wilks score in every group and then plot them out on a radar chart. If there is no bias between groups we would expect to see the data points trace out a circle around the chart.
Why should we use IPF lifters? Frankly speaking, the data sets of other federations are a mess. The IPF data is exceptionally clean and that’s going to help us extract some relationships from the data. Next, why use 1st place finishes and not 2nd, 3rd, … , etc.? The relationship between people who finished first is much more consistent than the relationship between any other place finish. Good models need good data.
 Figure 1: Age and Gender Bias in Wilks Scores
It turns out that only men’s weight classes follow the expected circular path around the chart. There is a significant gender bias favoring men as well as an age bias favoring the Open class.
Why worry about it?
Let’s step back for a moment. Why are we concerned with eliminating bias anyway? Suppose we want to compare the winner in a heavyweight class who just barely edged out his competitors in a tight finish, to a winner in a middleweight class who absolutely smoked his competition. Wilks should be able to determine that the middleweight had the superior performance, and indeed it does — at least for men in the open class. Tough luck if that’s not you. What if you are David Ricks, who at 57 years old could edge out people half his age in the same weight class (3)? That’s a phenomenal achievement, yet Wilks ranks it no better than the exact same finish by a 26-year-old at the same body weight. Any reasonable person would tell you that David Ricks had the greater relative strength.
In a previous article we illustrated the relationship between age and strength. Briefly, age is not a relevant factor in the exhibition of strength if you are a beginner, however, it is a major factor if you are near the limits of human performance.
Why should we eliminate bias? Increase competitiveness across the board and new stars will emerge (or to be more accurate, get the recognition they deserve).
Let’s get back on track.
This whole concept of relative strength started from the fact that strength is dependent on body weight and, therefore, we need to consider body weight in the comparison of strength. So what about age? In a previous post on age and strength we pointed out that among the top 16% of IPF lifters, age accounts for 83% of the variability in strength after body weight is considered. Any relative strength model that attempts to make a fair comparison between individuals also needs age as part of the equation.
Let’s summarize what we have so far. Three models were compared using the same IPF data shown in figure 1. In addition to noting biases, we’ll also measure the coefficient of variation (CV) — a measure of how close the model predictions are to actual values, where lower is better — and the amount of variation in the data explained by the model (R-Squared).
Table 1: Relative Strength Model Comparisons
| Model | Biases | CV | R-Squared |
|---|---|---|---|
| Ratio | Gender, Age, Weight | 25.7 | 0.50 |
| Allometry | Age, Weight | 3.3 | 0.71 |
| Wilks | Gender, Age | 2.2 | 0.95 |
The ratio method performs quite poorly and allometric models are a big improvement. Meanwhile, it appears Wilks does a good job in making accurate predictions and accounting for the vast majority of the variability. It does, however, have those gender and age biases we pointed out.
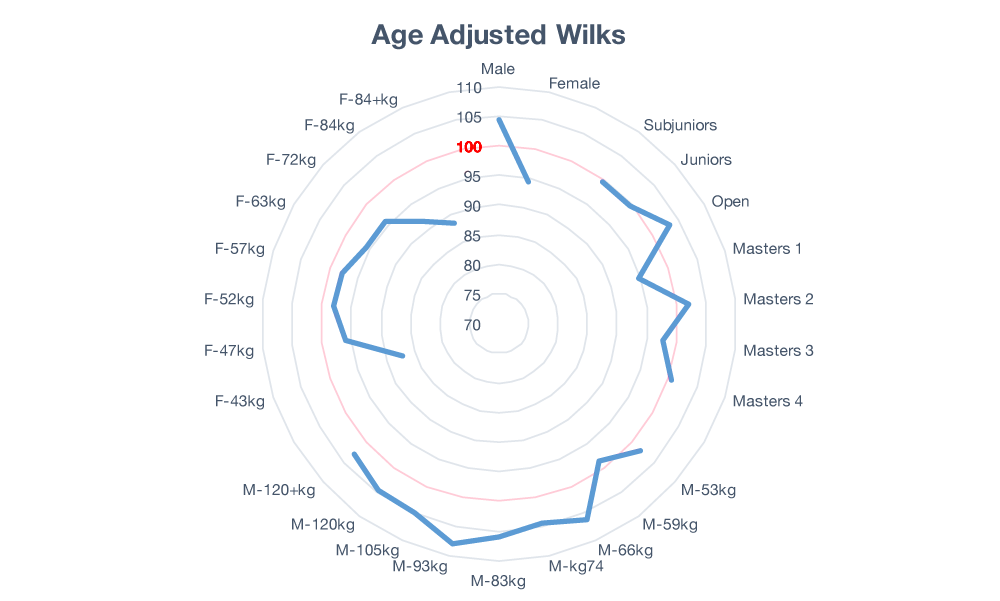
Maybe we can patch Wilks up. Let’s start with an age correction factor. In the process of doing so, we’ll also normalize the age corrected Wilks so that a value of 100 corresponds to the average 1st Place finish in any class.
Figure 2: Age Corrected Wilks Still Showing Bias
If everything worked perfectly, we’d expect to see the blue lines track a nice circle on top of the red line at 100. It does not. So, it looks like the adding the age correction was a failure. We’ve managed to mess up the men’s weight classes and worsen the existing bias between men and women. On top of that, it appears that we didn’t even fix the age bias. So much for that idea.
Closer examination of the age classes, however, reveals that the age class situation is a little more complicated than it looks. For example, someone who is 45 years old should be in the Masters 1 class but some of them chose to compete in the Open class instead. If we manually sort everyone back into their respective age classes, the age bias does indeed disappear. Unfortunately, that still leaves the gender and weight biases in an even worse state than what we started with. Oh well.
We need a fresh start
Let’s start from the ground up. Here are some factors we know affect strength (at least in terms of powerlifting results).
- Age
- Gender
- Weight
- Height
- Muscle mass
- Training age
- Muscle architecture
- Body segment lengths
- Other stuff
It turns out that only the first six variables account for 89% of the variability in strength between individuals in a general population of weight training adults (more on that another day). So if we are going to start over and create a new relative strength model from scratch, we need to use at least the first six variables, right? Not necessarily.
Yes, we do need at least six for a general population. But the population we are speaking of specifically today is the population of 1st Place finishers at IPF World Championships. We want a formula that determines the champion of champions. For this population, additional training time is not going to lead to significant increases in strength. They are already near their maximums. Training age matters for beginners, where an extra year of training matters a lot. But after 10 years of training, one more year doesn’t have remotely near the same impact. For our sample population of 1st place finishers, training age is no longer a relevant factor. Additionally, they have accumulated as much muscle mass on their skeleton as they are going to. Their height has essentially determined their weight class. For this population, almost all the variability in results is explained by only the first three variables– age, gender, and weight.
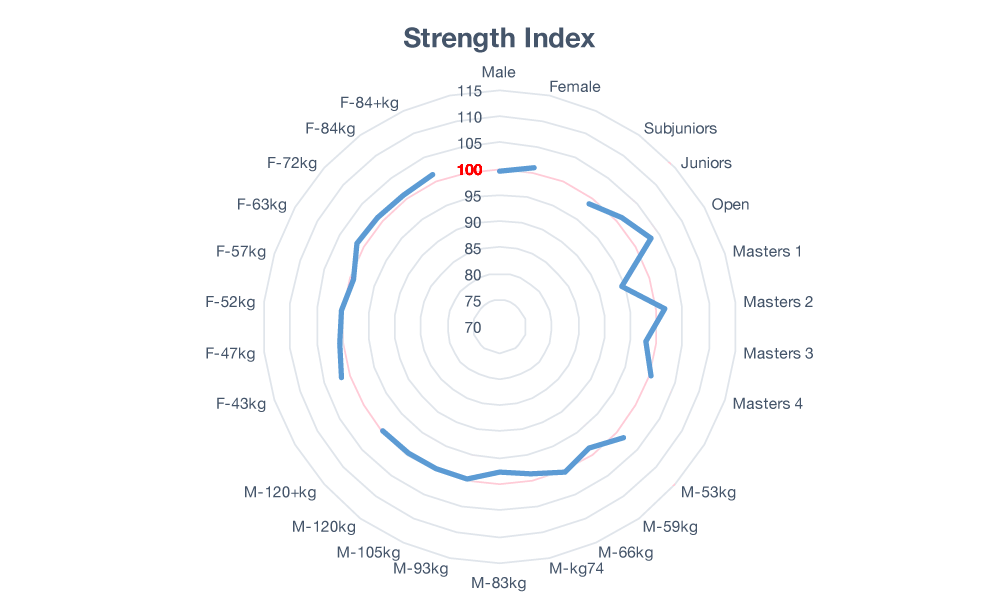
So let’s try and create a relative strength model that utilizes these three variables from the ground up. Once again, we’ll set 100 to be the average 1st Place finish and we’re hoping to see the blue data line track a circle around the chart.
Figure 3: Reduced Bias Strength Index
That looks much better. We’re almost seeing a blue circle. We’ve got almost no visible bias — within error — between all classes except for the age classes. However, recall that some of the Masters 1 lifters switched over to the Open class. Which lifters were those? The top half. If you place those Masters 1 lifters back into their class, the class as a whole rises and the Open class decreases a proportional amount. Do that here and we’ll see the nearly perfect circle that we’re looking for. That means our champion of champions can now emerge from anywhere and we’ve got a much more exciting sport to watch and participate in.
Scratch biases off the to-do list. But before we celebrate, we need to go back and check our other measures of model quality — the coefficient of variation and r-squared. It’s quite possible that fixing one thing breaks something else.
Table 2: Updated Model Comparisons
| Model | Biases | CV | R-Squared |
|---|---|---|---|
| Ratio | Gender, Age, Weight | 25.7 | 0.50 |
| Allometry | Age, Weight | 3.3 | 0.71 |
| Wilks | Gender, Age | 2.2 | 0.85 |
| Strength Index | None | 1.6 | 0.94 |
Boom. We’ve got a winner. The Strength Index gives us the most accurate scores, as indicated by the lowest CV, as well as matching Wilks in terms of accounting for variation. It seems like we’re looking at the next generation of relative strength models.
Math tip: Age, gender, and weight account for 94% of the variation in strength among the 383 IPF 1st place finishers. That means every other thing that you can think of that matters — all together — account for no more than 6% of the remaining variation. But remember, that changes as soon as you start looking beyond 1st place. As soon as you do that you’ll have a more complicated situation and variables like height, muscle mass, and training age will have greater significance.
So now that the overall winner is no longer guaranteed to come from the Men’s Open, how does the top five relative strength list look in an unbiased model? Check it out. These are the new outliers.
- David Ricks, 125 Strength Index (M, 57yo, 93kg, 790kg total)
- Yan-Fei Zhao 123 Strength Index (F, 21yo, 84+kg, 525kg total)
- LeeAnn Hewitt 123 Strength Index (F, 17yo, 84+kg, 615.5kg total)
- Jennifer Thompson 121 Strength Index (F, 43yo, 63kg, 476.5kg total)
- Anthony Harris 120 Strength Index (M, 52yo, 120kg, 865kg total)
And what about the previous IPF lifter with the highest Wilks, Sergey Fedosienko? He’s still an outlier sporting an impressive 115 Strength Index, placing him significantly higher than the average 1st place. It just turns out that there are a few other noteworthy outliers in other classes as well.
Want to calculate your Strength Index? You can try it here.


