Factor analysis in predicting strength
What’s the most important factor affecting strength in the context of the squat, bench, and deadlift? It depends on who you ask. Conduct a survey and you’ll come back with a variety of answers. However, you’ll probably find a consensus centering around muscle mass and its indirect relationship with body weight. A bigger person — especially if they are more muscular, although itself no guarantee — is probably a stronger person. Besides that, you’re likely to get some statements about sumo vs conventional deadlift, range of motion, age, low-bar vs high-bar squat, testosterone concentrations, gender, muscle architecture, training age, and so on.
It would be hard to dismiss any of these additional factors as irrelevant as there are clear examples in the scientific literature demonstrating their relevance. Challenge someone that “X” factor is not important and they’ll come back after a quick search with studies in hand to shut you down. But dismiss we can. In fact, it happens all the time and is totally legitimate.
The key is recognizing and understanding the differentiating characteristics between populations. Probably the most common encounter with this is when we read about some new chemical that has been shown to kill cancer cells — in a petri dish. Yeah, that’s great. Killing cancer cells in a human body is just a little bit different. Even better is when the cancer cells are selectively killed in the body and not wiped out along with everything else, a.k.a. chemotherapy. Then there are the studies done in mice that never translate into meaningful results in humans. And finally, a bit closer to home, studies that were done on untrained populations, or the elderly, that don’t mean much outside of those populations.
Today we are going to examine the question of strength and the relevance of several predictors, in the context of specific populations. We’ll use some concrete examples that build on previous articles published here and set the stage for a few more. To do that, we’ll bring up some data and do a bit of regression analysis. But before we begin, we’re going to need just a little refresher on regression analysis in order to make the most of what we’re going to look at since this whole thing rests on appreciating the significance of one important nuance. Feel free to skip ahead if you’re already fluent.
Begin Regression Primer
Let’s start by taking a look at a really simple relationship from a survey done over at /r/weightroom a few years ago. In general, although not always, a taller person is a heavier person.
Figure 1: Height vs Weight
Since there is a general relationship between height and weight, we can model it, or approximate it, by the given linear regression equation.
weight* = 95 x height – 84 R-squared = 0.32 (1)
Note here that plugging in a height gives you an estimated weight, denoted by the asterisk (*), not the actual weight. The actual weight is given by the following, where “u” is the error.
weight = weight* + u (2)
So that should be pretty simple. You take the estimated weight then add the error factor to arrive at the true weight value. Now we can rewrite the first equation in terms of the true weight by including our error term.
weight = 95 x height – 84 + u (3)
So what was the point of that? The error term, u, is where all the other relevant factors that affect weight are hiding. You can see height in the equation but where are all the other factors you can think of? They’re buried in that constant somewhere. Things like average daily calorie intake, activity level, genetic factors, and so on. They’re all bundled up inside u. Our r-squared value of 0.32 tells us that height — our observed variable — explains about 32% of the variability in weight. That means that u — our unobserved variable (or variables) — accounts for 68%. So, while height is an important variable, we’ve still got some significant unobserved variables to look for. Fortunately, we have a little more data to work with in the survey.
We know that squat 1RM is correlated with body weight. We could try pulling that out of u. Doing so will give us two independent variables (height and squat) and one dependent variable (weight). This time we won’t be able to draw a regression line since we’ll be working in 3-dimensions.
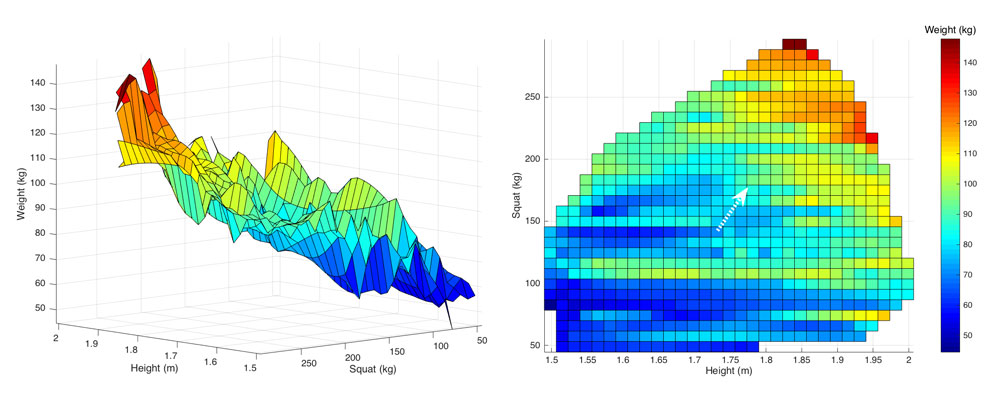
Figure 2: Height vs Squat vs Weight
In three dimensions we can still observe noticeable trends. Being taller and having a greater squat is associated with higher body weight. If we plot a plane through the data, similar to the way we plotted a line in figure 1, we come up with this new model for the data:
weight = 82 x height + 0.17 x squat – 85 + u R-squared = 0.50 (4)
Pulling the squat out of u bumped our r-squared up a bit and shrunk u. We could go on like this and if we extracted every variable that matters from u, it would reduce to zero and there would be no error in our model. That is very often completely unnecessary and we just have to settle for an r-squared where we have minimized u to an acceptable degree.
To spice things up a little bit, we don’t need to restrict ourselves to linear relationships. But we’ve covered enough to get a general idea. So let’s move on.
End Regression Primer
Whew, you made it this far. In a previous article on the measure of relative strength we prefer, we looked at the population of 1st place finishers at an IPF world championship since 2012. We stated that we were able to model these athlete’s totals (sum of best squat, bench, and deadlift) using age, weight, and gender as independent variables with an r-squared of 0.94. The equation we came up with looked like this:
1st place total = f(age) + f(weight) + f(gender,weight) + f(age,weight) + u (5)
We use f(x) here to denote non-linear variable transformations. These four variables alone account for 94% of the variation in 1st place results. Not much is still hidden inside u and anything that is will not make much of a difference. You should be fairly comfortable in not worrying about height, sumo vs conventional, body segment lengths, high bar vs low bar, or whatever else that comes to mind. But the real key here, which can’t be overstated, is that all these other things that you can think of don’t matter specifically to the population of 1st place finishers. They very well might matter to a different population, as we’ll soon see.
Let’s apply the same technique and extend it to anyone who participated in the same IPF events, not only those who placed 1st. Here’s what we get:
IPF total = f(age) + f(weight) + f(gender,weight) + f(age,weight) + u (6)
This time our r-squared drops to 0.88, which doubles the size of our missing information, u. Anyone wanting to make a case for additional factors beyond age, gender, and weight has a stronger case when they look at everyone who placed at an IPF world championship event instead of only at the winners.
If we expand our analysys even further to include recreational lifters, as well as competitors, we expect to see continued reduction in the predictive power of only age, gender, and weight.
Table 1: Brief Summary of Statistics
| Sample | N | Median Strength Index |
|---|---|---|
| IPF (1st place) | 383 | 100 |
| IPF (other) | 2,551 | 90 |
| /r/weightroom | 1,013 | 55 |
Want to measure your strength index and see where you stand? Try it here.
Let’s see how well our prediction does when we look at the data in the /r/weightroom survey.
/r/weightroom total = f(age) + f(weight) + f(gender,weight) + f(age,weight) + u (7)
In this case, r-squared drops down to 0.40. We’ve now got some much more significant missing variables to pull out of u. Perhaps not surprisingly, the magnitude of predicted totals successively declined between equations 5, 6, & 7. It might, therefore, be useful to know whether an individual competes or not, since competition seems associated with higher totals. Non-competitors also have a broader distribution of body thickness, so height could be another useful variable. Moreover, we really need to know how long someone has been training. Let’s try again with these added variables (ht = height; exp = months of training; compete = true/false).
/r/weightroom total = f(a) + f(wt) + f(gndr,wt) + f(a,wt) + f(ht) + f(exp) + f(a,exp) + compete + u (8)
The addition of these three variables boosts r-squared up to 0.65, which is a significant improvement, yet still leaves a lot unaccounted for. Body composition might help. It might also be useful to know what kind of training approach was taken, the level of sustained motivation and effort, and whether or not training was specifically directed towards increasing one’s total.
Table 2: Contributions by Variable
| Age | Gender | Weight | Height | Experience | Compete | u | |
|---|---|---|---|---|---|---|---|
| IPF 1st Place | 22% | 35% | 37% | <6% | <6% | NA | 6% |
| All IPF | 14% | 38% | 35% | <12% | <12% | NA | 12% |
| /r/weightroom | 4% | 16% | 16% | 4% | 20% | 5% | 35% |
Notice that as one climbs up the strength index ladder the predictive power of age increases. Also, look at how the impact of experience changes, presumably because of less variation in training experience at the top along with the diminishing returns that come with additional training time.
Discussion: Look at the major influences on predicting the total for the /r/weightroom group. The single largest observed influence is training experience. Besides that, there is still a lot of room for unobserved influences. Do you think the influence of training experience on this group will shape the exploration of those hidden variables? Similarly, how do you think it feels as you climb up the ladder and the impact of age starts creeping up on you?
Is this all just a bunch of mental masturbation, or what? Absolutely not. There is a very practical application for all this exploration. First, beyond simply knowing what matters, it’s very important to know when it matters most. With a clear view of the important milestones up the ladder, you can plot out a coherent strategy for getting there without too much deviation into the land of wasted time — a place many of us have strolled through once or twice.
Maybe that’s too abstract and you want a concrete example. No problemo. Scroll back up to equation 8. Let’s hold everything constant and look at the relationship between training experience and strength.

Figure 3: Strength vs Training Experience
What you’re looking at it the average path the strength index follows as one accumulates training experience. We could use that as a benchmark you could compare yourself with. You probably already measure yourself against the accomplishments of champions (the strength index is a percentage of a typical championship total afterall). But it might also make sense to look at how you compare with people with a few more matched variables beyond age, gender, and weight. If you’re surpassing them even with these extra factors included, you must be doing something right. So, by all means, keep doing it. If you’re coming up short then maybe some adjustments are needed. We could also use this to get an idea how often training maxes will need adjustment and plan training accordingly. So this is some pretty practical stuff.
One challenge in doing this effectively is the confidence bands leave a lot of room for significantly different paths. It would be nice to tighten those up a bit so we could feel a bit more precise is setting up benchmarks.
Go take another look at equation 8. Training experience also shows up as an interaction with age. It turns out that if you segment the data sample by age and look at the strength index paths there is a definite difference that looks a bit familiar, which we can summarize in the following graphic.
Figure 4: Interaction of Age with Strength Progression
Pick an age and check the size and direction of the nearby arrows. Think of them as the direction the current is flowing at a particular moment in life. If training begins at 20 years old the strength index path shown in figure 3 is pushed up above the average. Conversely, start training at 40 years old and the curve is pushed downwards (to a lesser degree). The impact of training experience adjusted for age thus tightens our confidence intervals and improves the benchmarks we can set.
We can (and will in a coming update to the core training system) use this knowledge to grade the effectiveness of training in real-time and adjust accordingly. Has this kind of thing ever been done before? Well, yeah. It actually has been done. The Russian weightlifting apparatus entirely quantified their approach to training and enjoyed spectacular success as a result. Check out this brief article by Yasha Kahn for a few nice insights into their methods.
You might also be familiar with Boris Sheiko and the tremendous success he’s had in adapting these methods to powerlifting. His success is a convincing demonstration that these methods apply beyond weightlifting. So why not just follow Sheiko training? That’s exactly what you should do if you are interested in powerlifting.
Look at the following table. Athletes begin around 12 years old and start off with light training. By the end of the year, they should meet a general physical readiness standard, which might include timed runs, a minimum number of pushups, and so on. They also have to meet a gender and weight adjusted strength standard — 3rd Class Junior. As they get older, training volume increases, methods change, and the standards move up. It’s all very systematic. And most important of all, it works.
Table 3: Training plan according to age
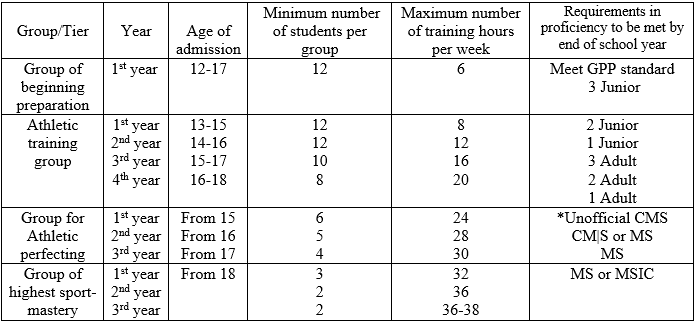
Now suppose your interests are not specifically powerlifting but do involve strength. You might want a more general approach. Let’s further suppose that you didn’t start when you were 12 and follow a systematic progression from then on. How would you adapt this for someone who started at 30? As we’ve seen in figure 4, training realities are very different at 12 and 30. What are the yearly milestones for the 30-year-old beginner? This whole thing is about bringing what has been proven to work to a more general audience and making it accessible to anyone.
That sounds like a practical application.
Update: You can see this in action with a recent addition to the app.