
Monitoring training stress with exertion load
This article has been updated (May 2019).
This chart reflects the conventional wisdom to use lower rep ranges if your goal is strength and moderate rep ranges for hypertrophy. Fortunately for you, dear reader is that things are quite a bit more interesting than they seem with this chart. What you are looking at is entirely the product of a new mathematical model accounting for training fatigue that starts with the premise that reps done closer to failure are more fatiguing than reps done further from failure — instead of treating all reps as if they were the same. Intrigued?
Ok, I know you want to see it. So let’s just get that out of the way first.
 Note: Exertion load is measured in arbitrary units of physical effort
There it is. Yeah, surprisingly enough that formula leads to the same conventional wisdom about rep ranges. It’s telling you sets of 3 for strength and sets of 10 for hypertrophy. Right, I’m probably going to need to back up a bit and tell you where this all came from.
Background
The general aim of training is to promote positive adaptations through the appropriate application of training load. That we know. So how do we measure the training load? In our world of weight training, the current go-to method is volume load (sets x reps x weight), also known as tonnage.
Volume load has been shown to have a positive dose-dependent association with both hypertrophy (Krieger, 2010) and strength (Krieger, 2009). The careful reader will note that these studies found a dose-response relationship with the number of sets. However, the study protocols entailed first matching subjects by strength and then randomly assigning them to groups. Volume load was thus directly proportional between groups to the number of sets, all of which were taken to failure, or very near (Krieger, personal communication, June 2016). More importantly, what is clear is that more effort (more sets/volume load) is associated with greater hypertrophy. That certainly sounds reasonable. Volume load, or the number of sets, is simply a proxy for measuring effort.
Examples of Loading Variables
| External | Internal |
|---|---|
| Volume | RPE or RIR |
| Tonnage | Heart Rate |
| Duration | Creatine Kinase |
| Intensity | T/C Ratio |
| Frequency | Lactate |
It might seem like semantics but it really is more than that. Volume load is an external measure of training stress, while effort is an internal measure. Internal stress is ultimately what drives a physiological response. Five sets of 200lb might be a warm-up for one person and an overload for another. The external load is the same in both cases but the internal load is not. The internal load is the one we really care about. By standardizing all sets at or near failure, volume load provided a convenient way to measure effort — or, the internal load.
That is not always the case. Analysis of app data has shown volume load and lean mass to have a correlation coefficient of 0.07 under non-standardized, “in the wild” conditions. Under laboratory conditions, volume load is a useful proxy for effort. The problem is not all training is standardized and done to failure, nor should it.
Let’s take a look at a couple examples of volume load limitations.
Exertion Level problem:
Case 1 – 1 set x 10 reps @ 70% 1RM
Case 2 – 10 sets x 1 rep @ 70% 1RM
In this example, the volume load is the same for each case. The trouble here is that every rep is treated the same when they are clearly not. As you go through a set of 10, the reps feel progressively more difficult. Meanwhile, the guy doing 10 sets of 1 coasts through his workout, barely raising his pulse. Volume load gives no insight into differences in internal load.
Stress non-linearity problem
Take your 1RM and do one set with that. Next, drop down to 50% of 1RM and do 2 reps. The volume loads of 1 set x 1 rep @ 100% 1RM and 1 set x 2 reps @ 50% 1RM are the same but the effort required is vastly different. Not only that but doing your 1RM is not simply twice as hard as lifting 50%. The effort required scales exponentially with an increase in intensity.
Update: While it is true that effort is non-linear as you move from 50% 1RM to 100% 1RM, the mechanical stress is in fact linear. See the follow-up article.
Volume and Intensity
It is thought that one way to address the limitations of volume load as a singular measure of training stress is to also examine the number of lifts (volume) and the average weight lifted (intensity). If both volume and intensity rise, this is considered an increase in the level of training stress. However, this gives us no additional insight beyond volume load, which would give the same indication. The purported benefit of volume and intensity is when examining high volume / low intensity and vice versa. So, how do you determine which leads to the greater training stress? Maybe it was the high volume day, or maybe it was the high-intensity day.
INOL, calculated as reps at a given intensity / (100 – intensity), is another approach that attempts to consolidate volume and intensity back into an alternative, singular measure of stress. However, like volume load, INOL also suffers from the exertion level and stress non-linearity problems. Moreover, by removing weight as a variable INOL introduces the third problem of an absolute load. Deadlifts for 3×3@90% has the same INOL score as bicep curls for 3×3@90%. Clearly, these two cases should not be treated as equivalent.
A Fresh Start
Yeah, we need one. Volume load does work, but it has clear limitations if you are not training to failure with every set. We need a way to see the effort in a set that volume load does not capture.
Update: Volume load seems like a shadow of something more fundamental. It often seems to pop up where you find progress being made. But volume load is not the end of the story. For example, if you take people not accustomed to regularly training to failure, put them into groups of 1, 3, and 5 sets to failure 3x/week, you’ll see a dose-dependent increase in hypertrophy with volume load. There is an increase in stress above baseline for each group. The same relationship exists with their training effort. Effort went up; results went up. Semantics? No, because now we can talk about optimizing effort and getting the most bang for your buck. That does not seem to be working out for people looking at volume load. See the follow-up article.
Why don’t we just look at a set then?
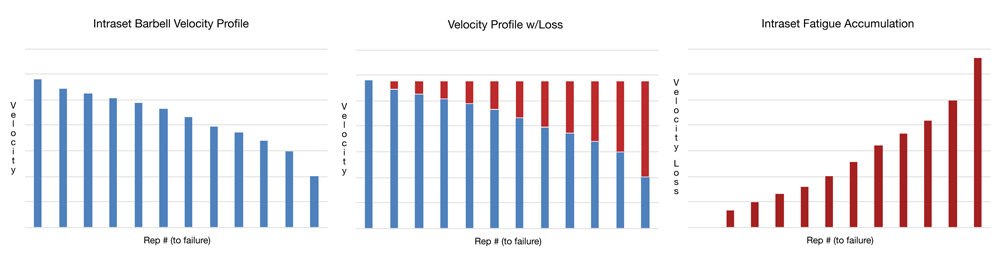 Here’s one. This is a set of 12 to failure. The difference in rep velocity compared with the first rep is plotted on the y-axis in red. Why are the reps slowing down as the set nears the point of failure? Fatigue. That’s an internal measure of stress. Velocity loss thus gives us a direct window into the accumulation of fatigue and internal load during a set.
Update: Lactate accumulates linearly with each rep and is related to the loss of force production. In the third chart above, the y-axis could interchangeably be labeled “Lactate”, “Velocity Loss”, or “Fatigue”.
Looking at the charts, it’s quite clear that reps performed in proximity to failure are more fatiguing than reps done further from failure. That addresses the exertion level problem. It’s also clear that the increase in fatigue is exponential. So that checks off the non-linearity problem as well.
In general, all sets will follow a similar curve. An even more precise method would be to track real-time velocity. However, the generalized curve is already a useful approximation that captures most of what was missing in volume load.
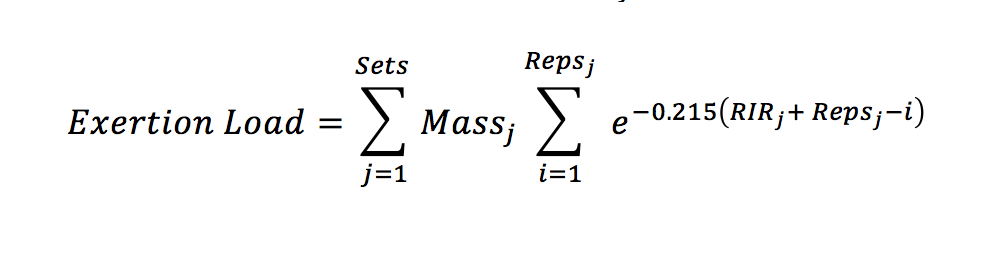
Exertion Load
We can define exertion load as the sum of weight lifted multiplied by a rep-dependent fatigue factor. Let’s see how that compares to volume load with an example set of 3 reps. In simpler terms, we will discount early and easy reps.
Volume load = weight x 1 + weight x 1 + weight x 1 = 3 x weight
Exertion load = weight x f1 + weight x f2 + weight x f3
For volume load, the weight is viewed from an external point of view. That is, the weight is constant. For exertion load, the weight in every rep is multiplied by an exponential fatigue factor (f1, f2, f3). From an internal point of view, the weight feels like it gets more difficult across the set.
It’s not as easy as sets x reps x weight but that’s apps are for, right?
Laboratory Study Insight
Let’s look at exertion load in action. Martorelli et al. (2016) showed that training to failure (RF) resulted in twice the increase in muscle thickness over 10 weeks compared to a volume load equated control group that did not train to failure (RNFV). Volume load failed to differentiate between these two groups but exertion load was higher for the RF group. The greater exertion load for the RF group suggested a greater physiological response was to be expected.
Update: Modified exertion load similarly predicts a greater metabolic stimulus in the RF group. See the follow-up article.
Schoenfeld et al. (2014) examined volume load equated powerlifting (7x3RM) vs bodybuilding (3x10RM) style workouts and found no difference in hypertrophy between groups over 8 weeks. There was, however, a larger increase in strength for the powerlifting group, where exertion load was much higher. Also significant was that a few subjects dropped out from the powerlifting group and those who remained showed clear signs of overtraining at the study conclusion. There were no dropouts from the bodybuilding group. Exertion load again captures the differences in training load.
So what about equal hypertrophy between groups? There might have been an upper limit to hypertrophy over the study period and the additional training load incurred by the powerlifting group was simply excessive. Indeed, in a meta-analysis Kreiger (2010) found a trend of increasing hypertrophy with increasing volume load but no significant difference in hypertrophy between 2-3 sets and 4-6 sets, suggesting an upper limit. It has also been shown by Damas et al. (2016) that excessive training stress can attenuate hypertrophy.
Update: Modified exertion load predicts similar levels of total stress (metabolic + mechanical) for each group, higher mechanical stress for the 7x3RM group, and higher stress optimization for the 3x10RM group. See the follow-up article.
Exploring Exertion Load
Since exertion load seems to match up fairly well with the real world, let’s kick the tires and see what happens. That old question: “how many reps should I do” always seems to come up. We might as well see what exertion load looks like for sets with different numbers of reps.
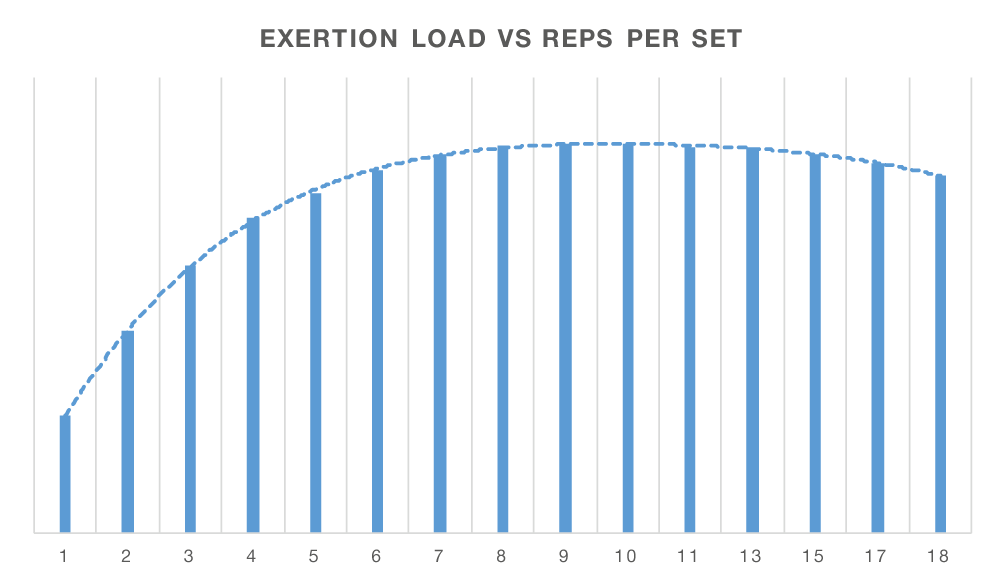 If the goal is simply to maximize the accumulation of fatigue like you might want to do if training for hypertrophy, you should probably aim for sets of 8-15 reps — according to exertion load. Isn’t that a nice coincidence?
Update: This chart changes very little with the new model. 8-12 reps is the new optimal zone and metabolic stress plateaus at 15 reps and stays there at least until 20 reps. See the follow-up article.
On the other hand, you might want to simultaneously maximize exertion per rep. The last rep on a 15RM set is challenging, but the first few reps certainly aren’t. If every rep is to be a meaningful rep, like you might want if you are strength training, the following graph is what you should look at.
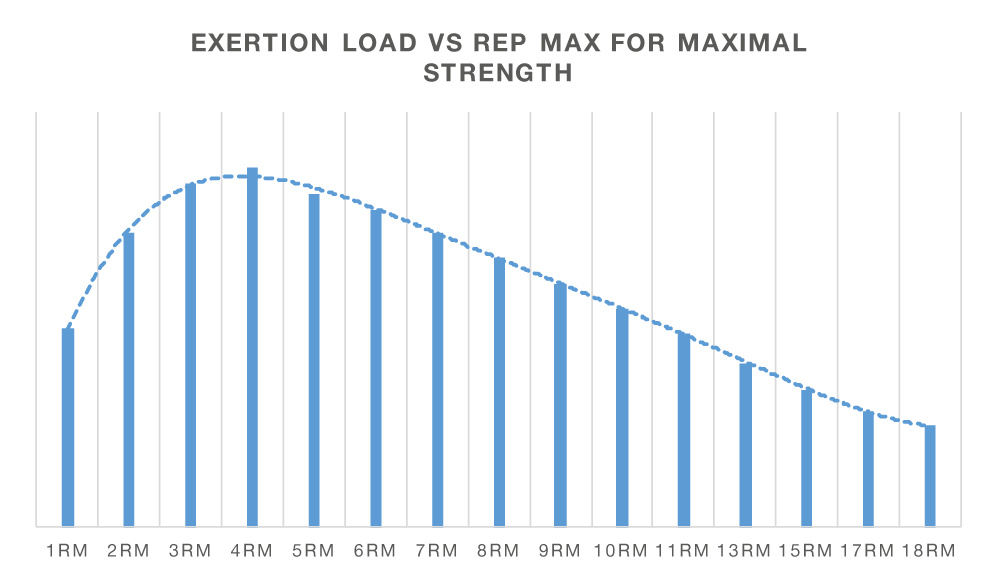 These also seem to line up fairly well with current best practices in strength training. To summarize, train in the 3-6RM zone with 1-2 reps in reserve (RIR).
Beyond hypotheticals, we can also look at exertion load in the preparation of an elite level powerlifter by Boris Sheiko for the European Classic Powerlifting Championship in 2016.
 The first thing we can see is the regular alternation of loading between large, medium, and small over a 4-week cycle. Next, we can see good agreement between the 21 and 7-day moving averages. Why is that important? You can think of the 21-day average as your baseline and the 7-day average as your short-term training stress. You don’t want your short-term stress getting away from your baseline unless you’re looking to overtrain and get injured or deload. Never the less, the large load days are clearly above baseline. So there is no shortage of days serving to push the athlete, yet there is balance with recovery to maintain the athlete’s health. This is the genius of the Sheiko system. He achieves the seemingly paradoxical task of a variable, yet constant stimulus.
Moving on, we can see that the loading is concentrated on variations of the main lifts (SPP), such as benching with chains or a board. There is also a significant amount of general work done, such as hyperextensions and other exercises (GPP) with an indirect relationship with the main lifts. Finally, there is the work done on the competition lifts themselves (TP).
Next up, let’s look at how loading changes as the competition approaches.

The first thing you notice is that loading decreases towards the competition date and there are no large load days. Next, there is a sharp drop in short-term load during the first week right as 1RM testing is done in preparation for the competition. Loading quickly resumes back to the maintenance level in the second and third weeks and then tapers off in the fourth. Also, notice that work with the main lifts (TP) replaces much of the supplementary work (SPP and GPP).
How has this translated into real-world results? Christophe has increased his results in every competition — not an easy thing to do when you total 900kg — and recently took silver in the deadlift at the IPF Classic Worlds in Minsk. Good job guys!
Bottom Line: You should be tracking your exertion load.
Update July 2018
I’ve recently come across a relevant study to help refine the exertion load equation:
Here’s what kind of predictions modified exertion load can do now:
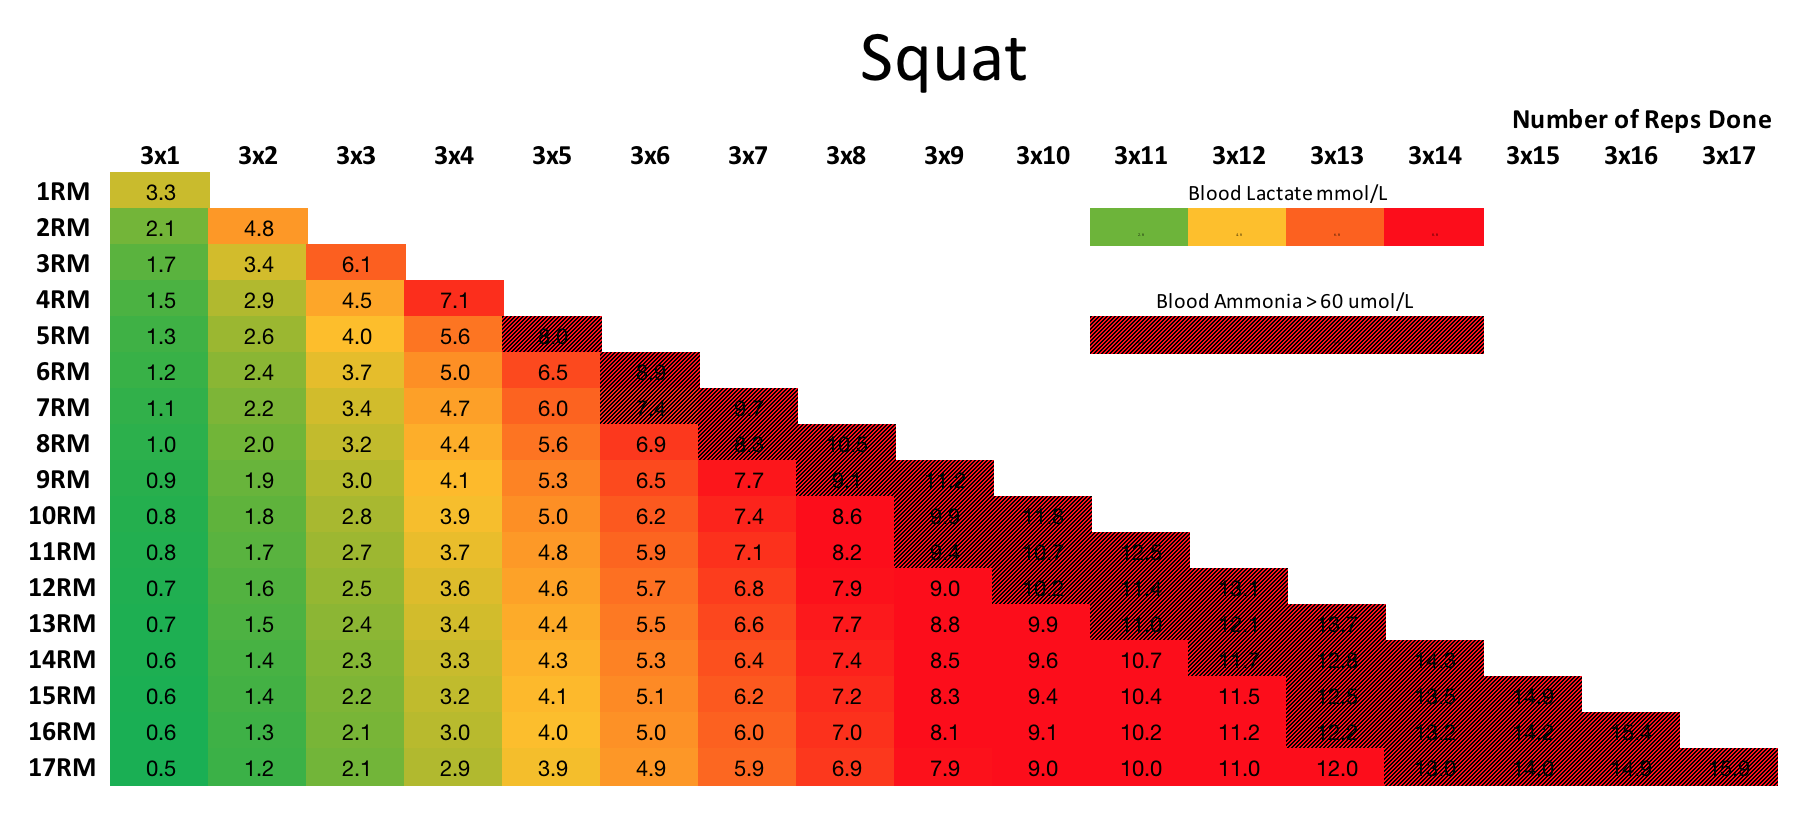


So there’s the data. A blood lactate concentration of 4 mmol/L is sometimes described as the lactate threshold and probably represents a critical point. With these two markers (lactate > 4.0 mmol/L & ammonia > 60 umol/L) we might be looking at the target training zones. As you can see, it’s easier to get there with squats and a bit harder with shrugs. That might be why some muscle groups seem harder to train and others seem to respond to pretty much anything.
Update May 2019
Part II convincingly demonstrated that Range of Motion (ROM) plays a critical role in the estimation of fatigue. The original Exertion Load formula has now been updated to include this term. This solved an important problem present in the original Exertion Load formula of stress equivalence, which I’ll explain in a moment.
 There’s another way to look at this calculation. You can probably see it if you remember high school physics. Let’s look again at a set of 3 reps.
Volume load = weight x 1 + weight x 1 + weight x 1
Volume load = weight ( 1 + 1 + 1 )
Volume load = weight x 3
Volume load treats each rep the same, regardless of the effort required to perform the lift.
Exertion load = weight x f1 + weight x f2 + weight x f3
Exertion load = weight ( f1 + f2 + f3 )
Exertion load = weight x Effort
Exertion load assigns unique scalars for each rep according to the rep difficulty. And now:
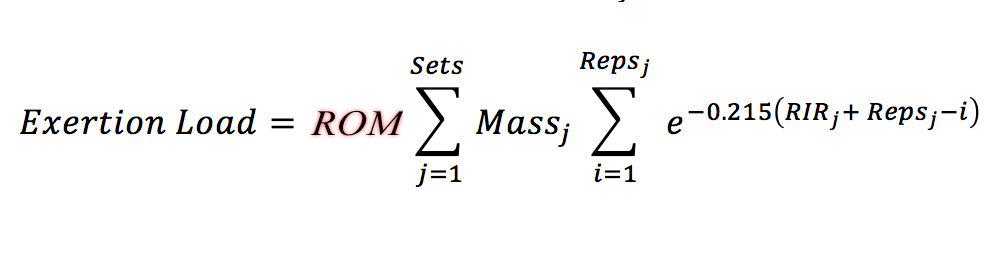
Exertion load (w/ROM) = ROM (weight x f1 + weight x f2 + weight x f3 )
Exertion load (w/ROM) = weight x ROM ( f1 + f2 + f3 )
Exertion load (w/ROM) = weight x ROM x Effort
Exertion Load is now essentially (measured in arbitray units):
Exertion load = Force x Distance x Effort
Exertion load = Work x Effort
I don’t know about you, but I’m pretty happy with how that looks now. Doesn’t that also make a lot more sense than weight x 3?
Stress Equivalence Problem
Suppose one does Barbell Calf Raises for 3×10 with 200kg. Earlier in the workout, Barbell Squats for 3×10 with 200kg were also done. All RIRs for squats and calf raises were the same. That produces the same Exertion Load. That can’t be. However, when you factor in range of motion, Exertion Load for the squats is much higher than for calf raises.
Additional Problems
As you want to expand the scope of exercises you can use with Exertion Load, some problems will inevitably pop up. I’ve recently been applying the formula to a variety of specialized exercises commonly used in Sheiko programs. For example, exercises using pauses or chains/bands require the use of a mass modifier term.
To make all this work, I encode each exercise with relevant metadata that enables the calculations to run properly.
Examples of Exercise Metadata
| Key | Variable |
|---|---|
| Name | Barbell Squat |
| Modifier | Concentric |
| ROM | 0.42m |
| Name | Barbell Squat (3s Pause) |
| Modifier | Isometric |
| ROM | 0.42m |
| Name | Bench Press (w/Bands) |
| Modifier | Accommodating |
| ROM | 0.24m |
| Name | Bench Press (Explosive) |
| Modifier | Dynamic |
| ROM | 0.24m |
Needless to say, these calculations are not really practical to do by hand. You basically need a computer to do them for you. Yeah, just use my app. I’ve done all the work setting this up so that you don’t have to.
